

One-quarter of the European Union’s electricity was produced by solar power for the first time ever in June 2026. This was the third month that solar has been the EU’s largest source of power – ahead of nuclear (21%), gas (15%), wind (14%), hydropower (12%) and coal (8%). 52 terrawatt hours (TWh) of solar power was generated in the EU in June, more than double the amount of solar power generated in June 2021 (21 TWh).
In Germany, 36% of electricity was generated from solar power in June 2026. In the first half of 2026, Germany installed 7.4 GW of new solar capacity, a 9% increase from the same period the year before. While this is of course a positive trend for the energy sector, the rapid increase in solar also has repercussions on our energy system.
Germany’s changing load profile
This rapid growth in solar is fundamentally changing how Germany’s energy system behaves. Compared with a decade ago, electricity supply and demand fluctuate much more throughout the day due to increased renewable energy capacity and rising electrification (e.g. electric vehicles and heat pumps). As a result, the country's residual load – the electricity demand not covered by wind and solar generation – is becoming far more volatile. As renewable generation increasingly surpasses total demand, residual load is more often going into negative. Meeting these larger swings requires greater flexibility, with technologies such as batteries, flexible electricity use, and other balancing solutions playing an increasingly important role in keeping the grid stable and making the most of this surplus renewable energy.

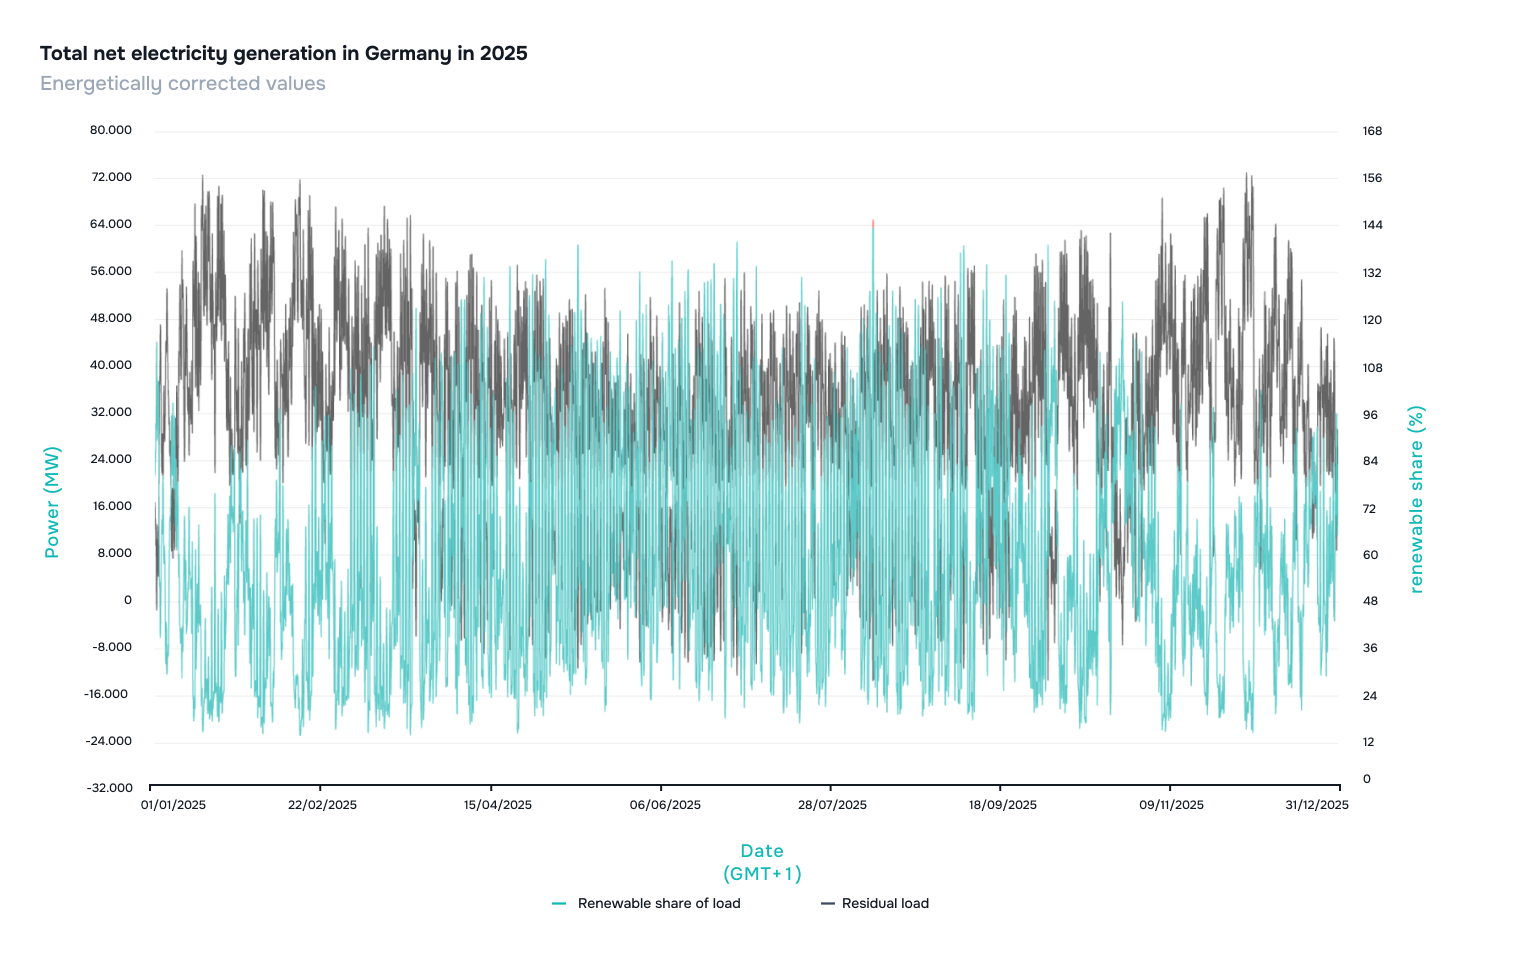
Here are some key takeaways from the changes over the years:
- Negative residual load is the new norm – more frequent periods in which renewable generation exceeds demand indicates the system is regularly producing more renewable electricity than can be immediately consumed, highlighting the importance of storage and demand-side flexibility.
- The growing number of crossover points reflects a more dynamic grid – the system requires much faster balancing capabilities than in previous years, and aligning consumption and feed-in with market and grid signals in real-time is increasingly important.
- If renewable capacity is not intelligently integrated, curtailment and grid congestion will become more likely – excess renewable generation must be shifted, stored, used or exported.
- Flexibility is becoming a core system resource – shifting the demand of small-scale energy assets to periods of abundant renewable generation and reducing demand during periods of scarcity is the key to increasing
If we look at total load, renewable energy share of load and residual load from June 2026, we see a clearer picture of how they interact. The total load shows higher demand in the morning and early evening, followed by lower demand overnight. The residual load tends to be a perfect mirror to the renewable share of load, meaning a higher share of renewables (usually in the middle of the day) causes the residual load to drop, and with it, reliance on prime movers like coal and gas.
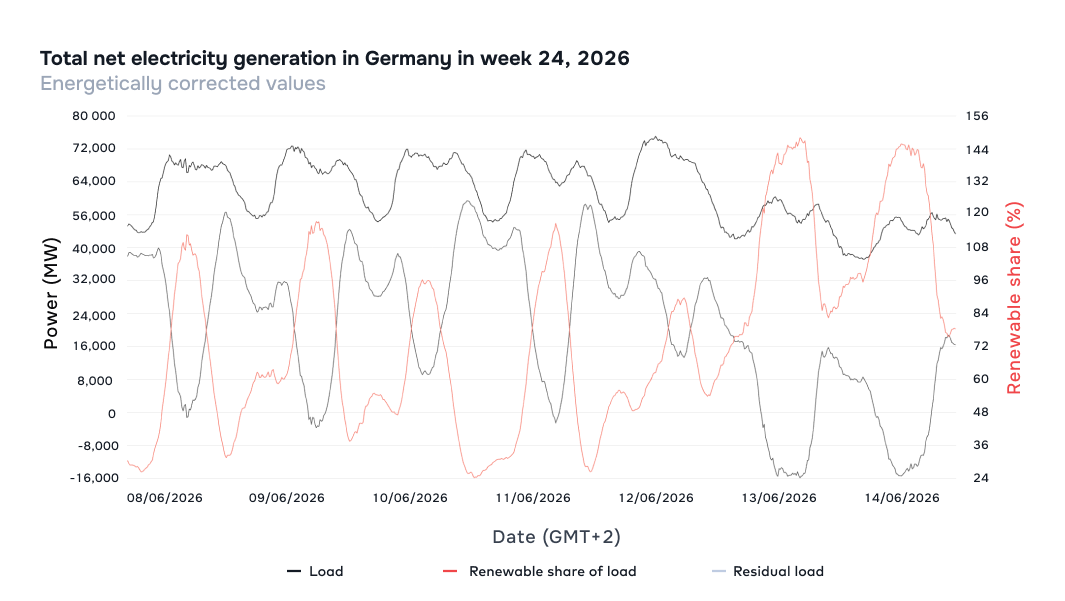
At the end of the week when the renewables share reaches over 100% (up to 148%) and the total load dips, residual load drops to a staggering low of -15,886 MW. This creates a huge amount of excess power that must either be intelligently used or shifted, or otherwise curtailed. The steep curve in and out of the drop means that that system must react incredibly quickly to account for the sudden climb in excess power.
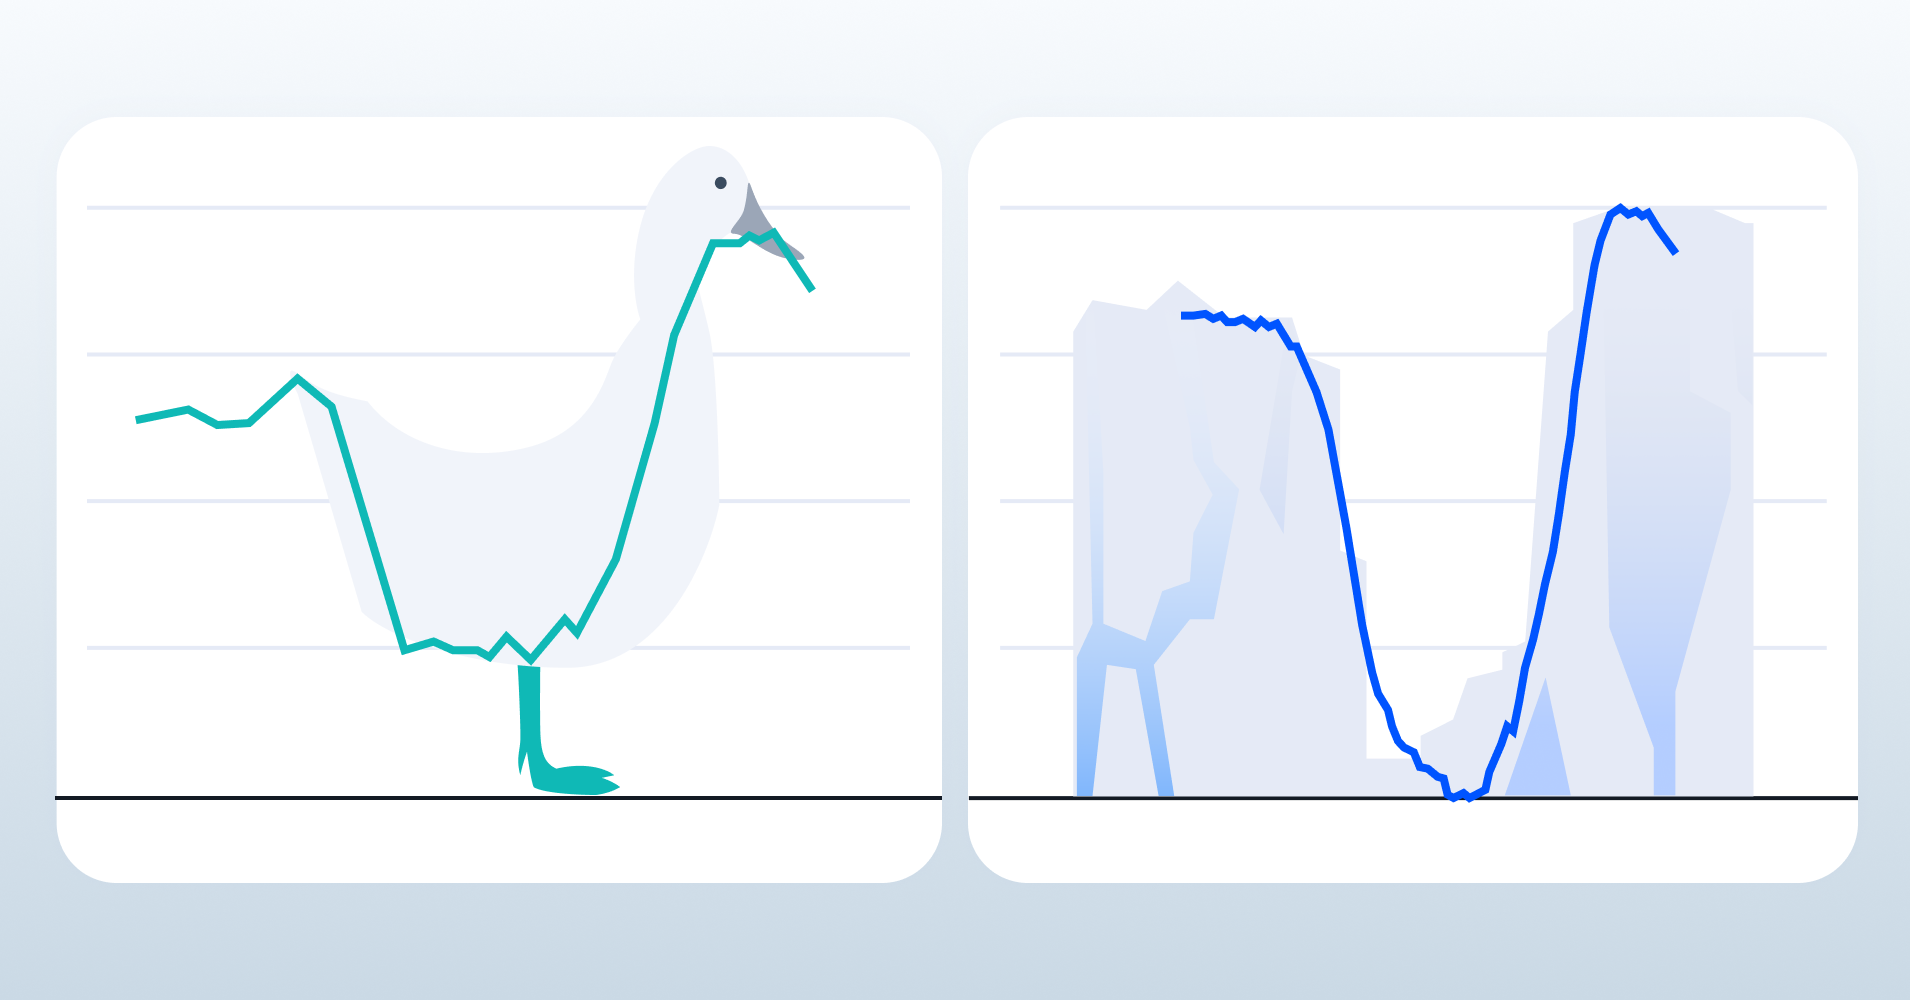
This following image shows the transformation of Germany’s duck curve from 2015 into a canyon curve in 2026. Simply put, dispatchable resources are reduced during the day but the need for flexibility drastically increases as the sun sets.
Now let’s compare the lowest residual load in each year from 2015 to 2023 in Germany.
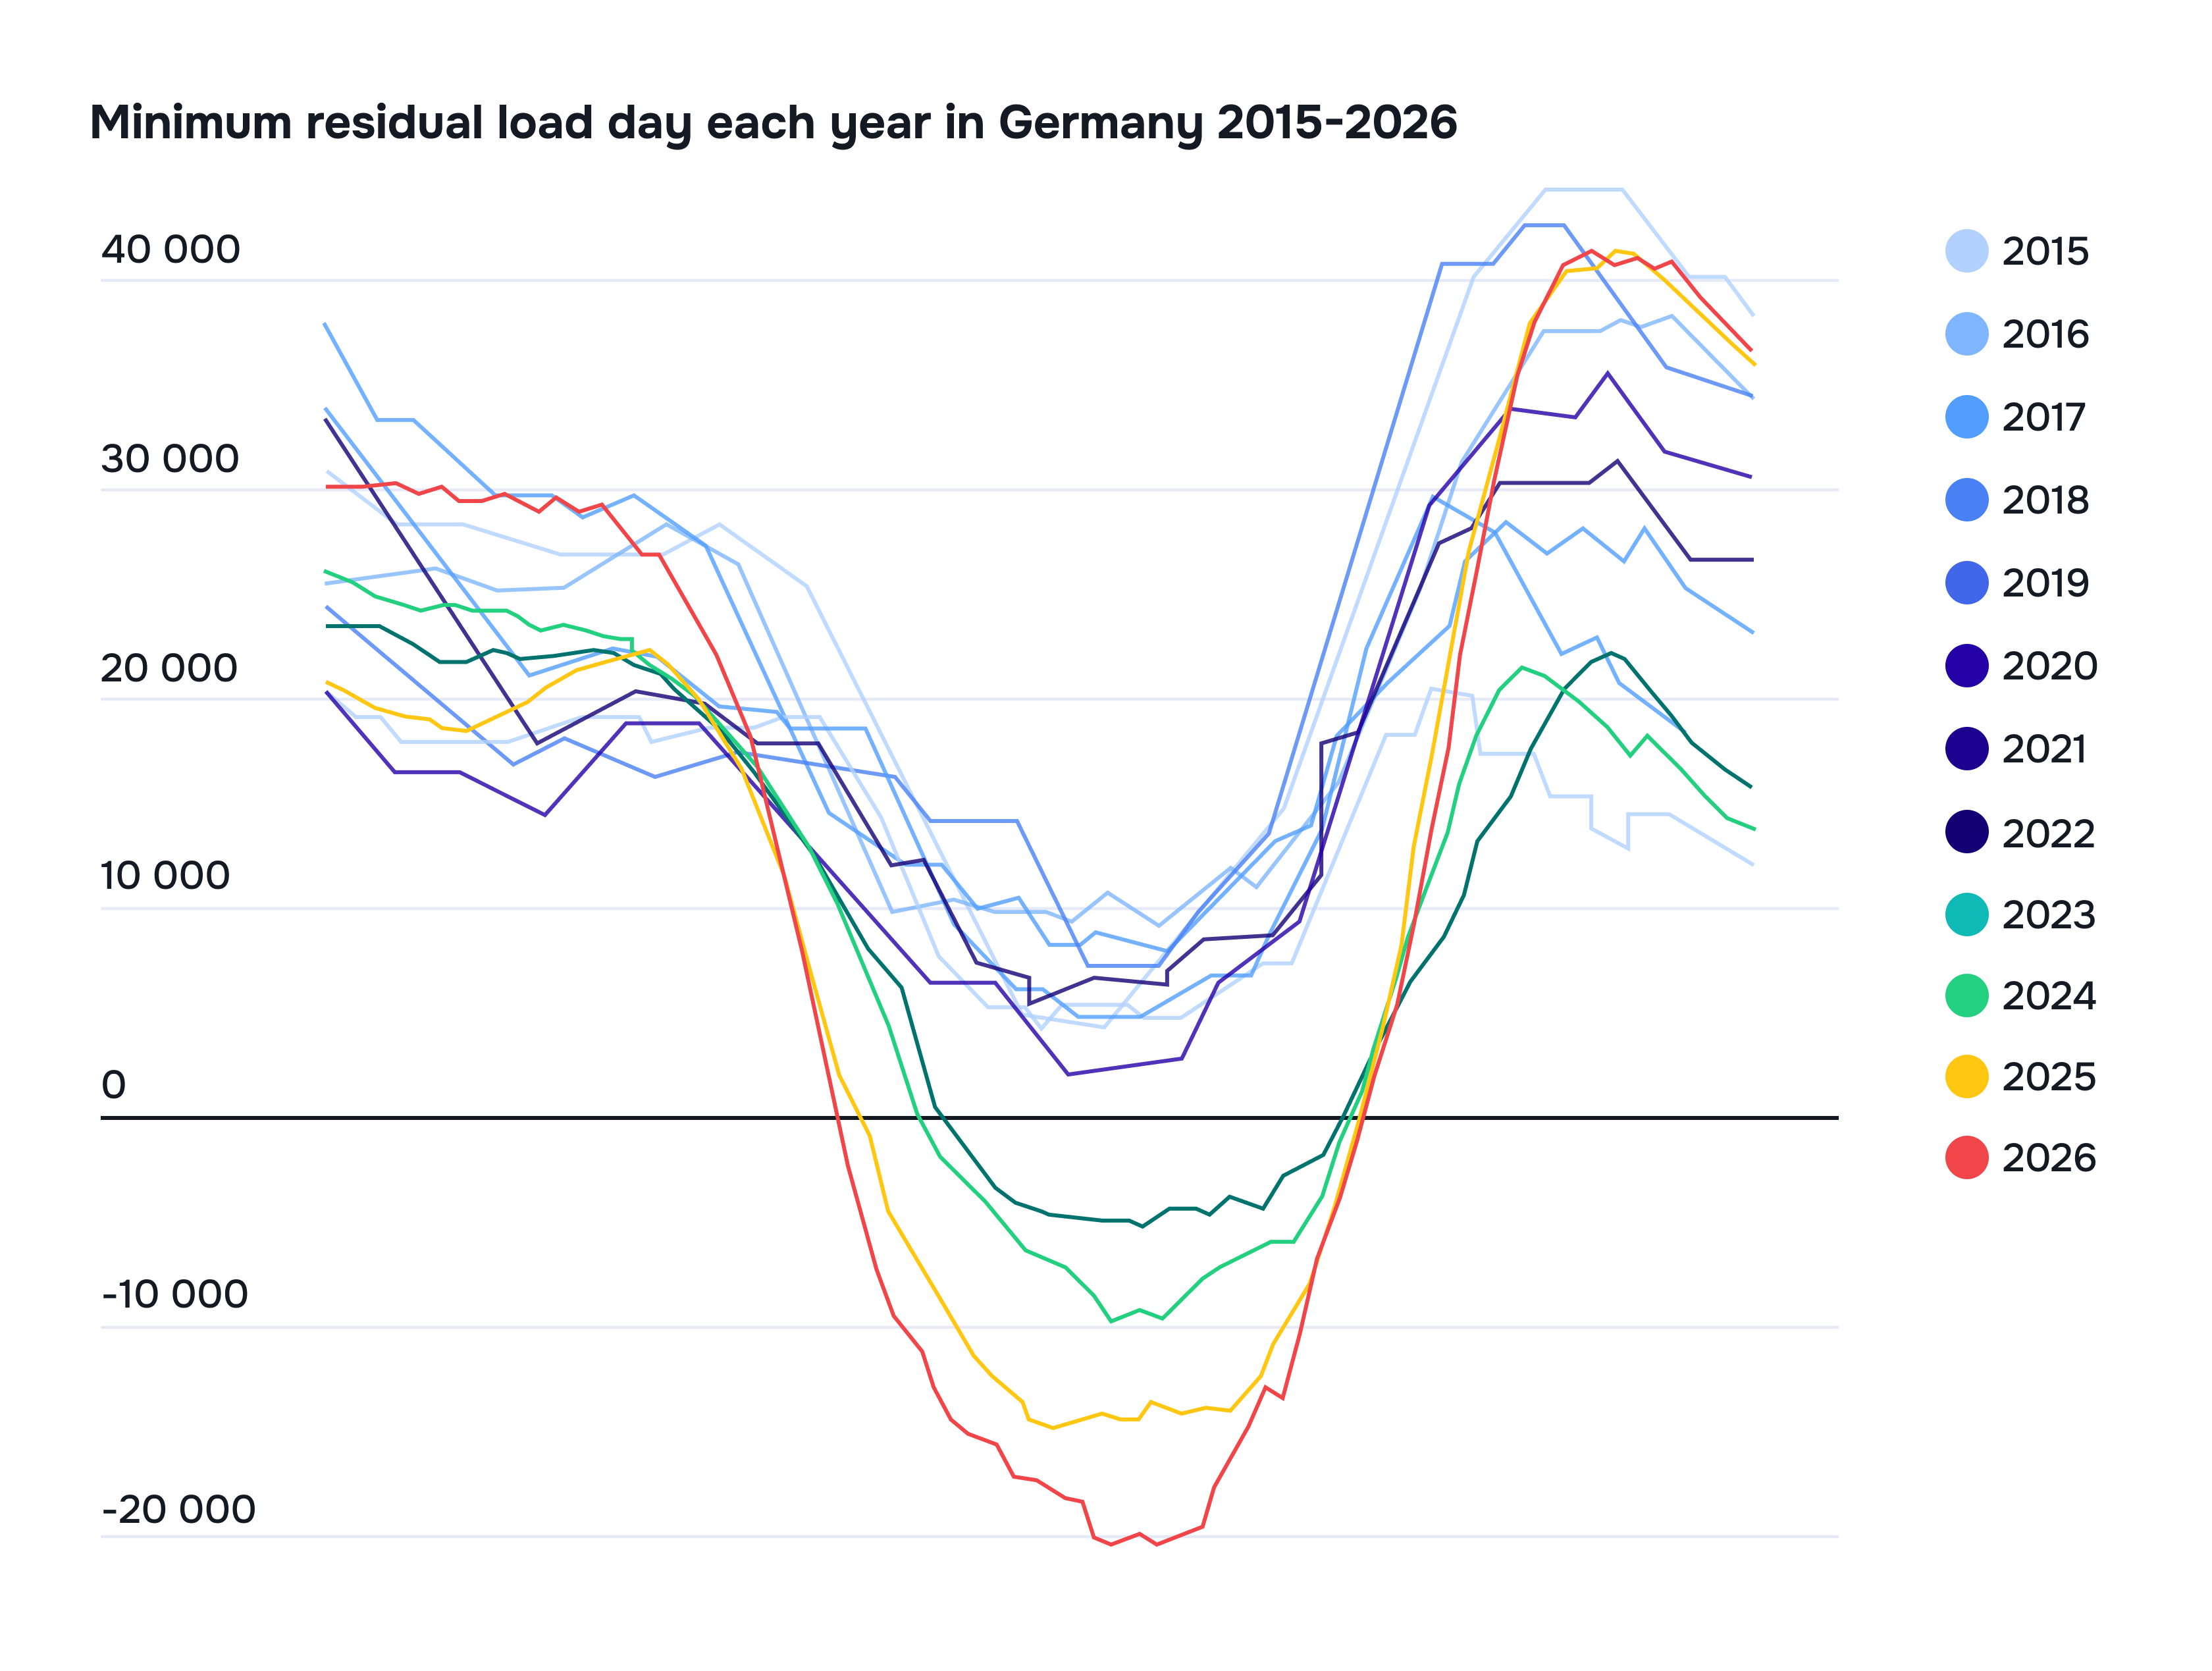
Here we see a very clear trend of a deeper and steeper belly as the duck curve turns into a canyon curve. As the curves in and out of these dips get steeper – and more often become negative – the need for flexibility increases.
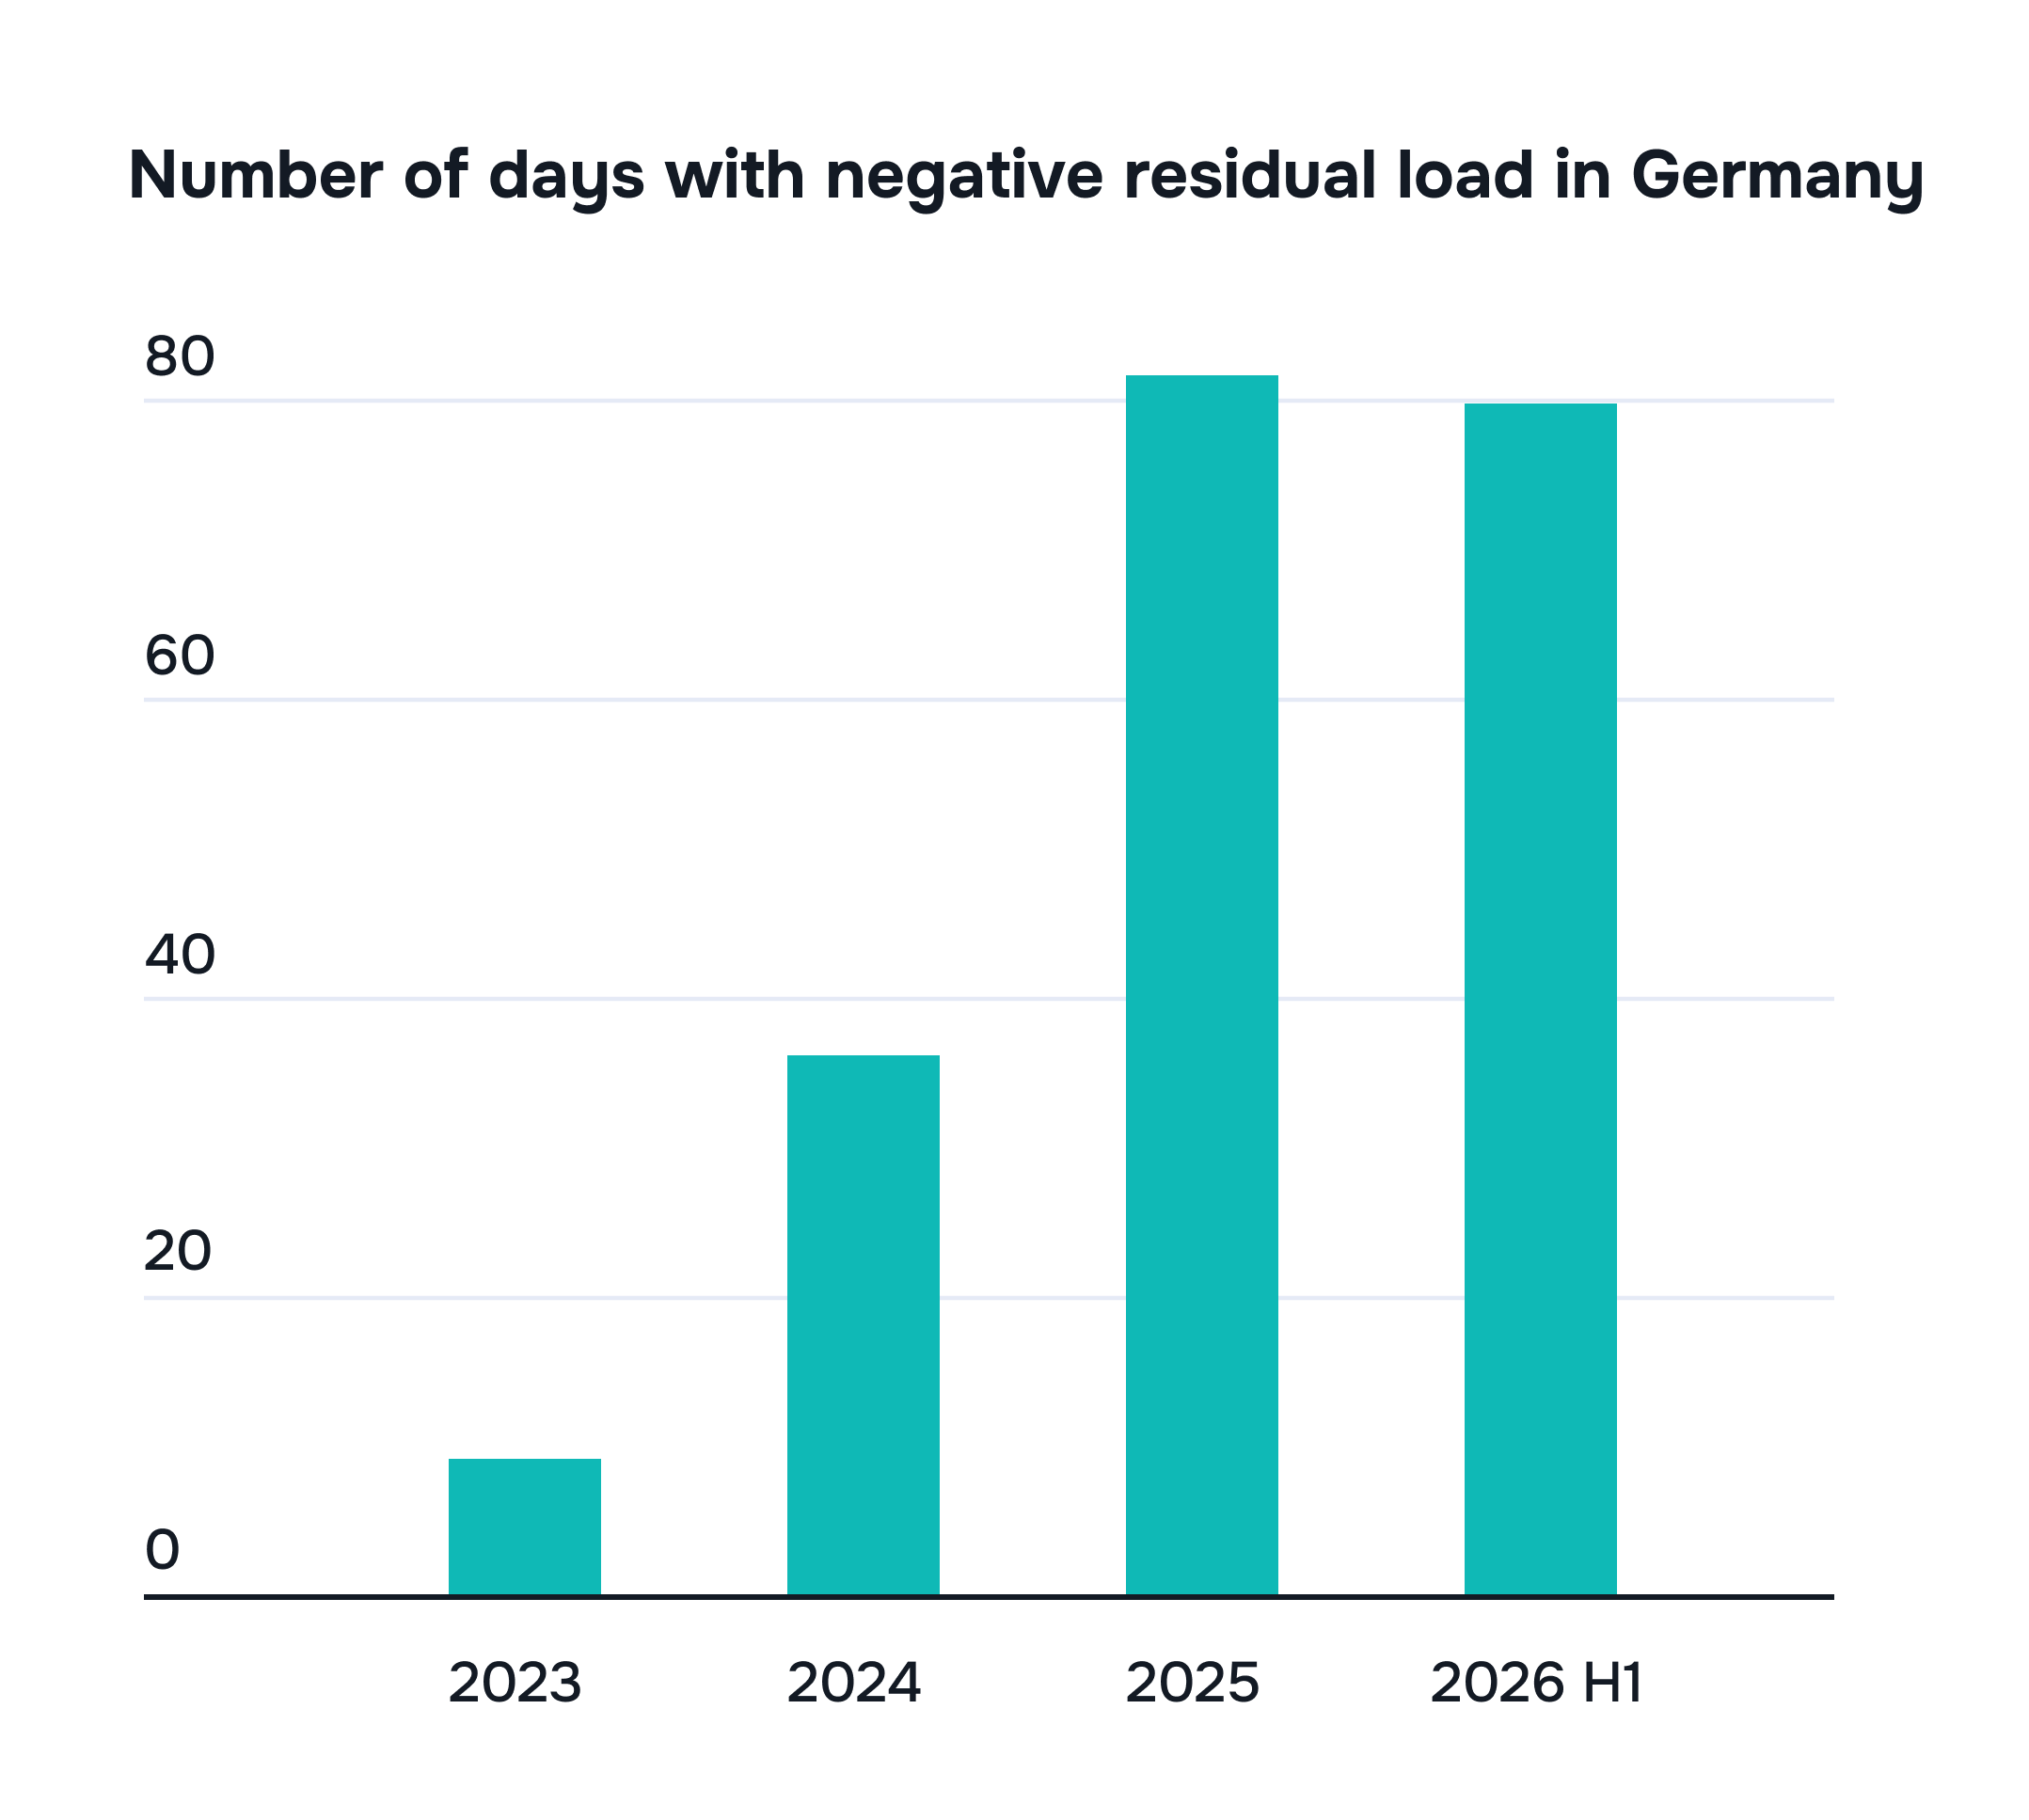
In fact, the number of days with negative residual load in Germany is rising each year, and with it the portion of demand that must be met by flexible resources. Negative residual loads are no longer isolated extreme events but consistent occurrences. In fact, in the first half of 2026, there were almost as many days with negative residual load than in the whole of 2025, and already more than double the number in 2024. This highlights the urgent and consistent need for flexibility in our energy system.
Climbing the canyon with demand-side flexibility
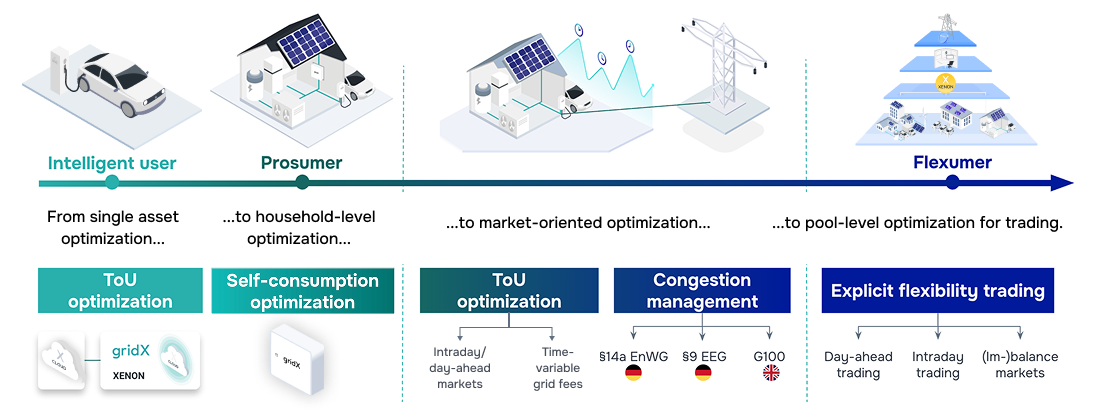
As with canyoning, the key is the right infrastructure and equipment to be able to react quickly to sudden changes. Both implicit and explicit flexibility services are crucial to properly integrate renewables into the system and better align consumption to periods of high generation.
- Household-level optimization: Self-consumption optimization makes prosumer households more self-sufficient and thereby less reliant on the power grid. At a system level, more intelligent use of self-generated solar power in turn reduces stress on the grid.
- Smart storage: Better leveraging household batteries, for example by leveraging battery arbitrage, allows prosumers to sell excess electricity back to the grid. Using electric vehicles as additional storage systems with bidirectional charging also turns them into assets that provide flexibility to smart grids. Regulation is now catching up, with MiSpeL, for example, encouraging a strong shift towards market integration of batteries and electric vehicles in Germany.
- Market-based load shifting: By automatically optimizing a household’s consumption according to dynamic tariffs, consumers are financially incentivized to use energy during low price periods and thus flatten out demand curves.
- Grid-based load shifting: By ensuring that energy assets behave in a grid-friendly way, adhering to regulatory requirements like §14a and §9EEG, grids become less congested, while consumers are again financially rewarded for dimming consumption in emergency situations. Automatically shifting demand based on variable grid fees is another lucrative way for end users to lower their bills while contributing to a more stable grid.
- Virtual power plants (explicit flexibility trading): aggregating the flexibility of thousands of decentralized energy assets allows them to function as a single dispatchable unit. Making this pooled capacity available for trading on wholesale and imbalance markets allows end users to save money or even generate revenue, it opens up new revenue sources for energy retailers and helps to better match intermittent supply with flexible demand on a large scale.
In summary, we shouldn’t fear the duck, nor the canyon. We need to use the deepening duck curve as a warning that renewable capacity additions are far outpacing the integration of flexibility in our energy systems, and this is simply not sustainable in the long term.
Energy retailers are the key drivers of this shift to flexible energy systems and stand to profit by opening up new revenue streams, offering more value to end customers, while also contributing to a more stable renewables-powered grid.
We have the resources at our disposal, we simply need to make better use of them.


.svg)

.svg)